Is your eye surgery website good enough?
The five most essential website metrics for cataract and refractive surgeons
One of the best things about the internet is that we can measure everything. However, with this plethora of data, it becomes a challenge to identify what data matters.
You might ask some of these common questions about medical websites:
- How do I know if my website needs a redesign?
- How do I know if my website is good enough?
- How do I define success with my latest website?
- And finally, how do I definitely measure and know whether my website continues to do its job over time?
Here are the five website metrics that we use as our criteria for success. You can ask your web developer to report on these 5 metrics too. You can also use these metrics to decide whether you need to redesign your website so you can hit the benchmarks I recommend.
- Search visibility
- Bounce rate
- Pages/Session
- Average Session Duration
- Conversion Rate
1. Search Visibility: Your website’s first job is to make you visible
Your website’s most important job is to make your brand visible to the market that searches for what you do.
Without visibility, nothing else matters. Not your content, your design, nor any functionality your website has. It’s all for nothing without visibility.
So, how can you measure how visible your website is for the keyword phrases for which you want to rank?
There are several valuable and free metrics you can use to gauge the visibility of your website. One metric we use is Google Search Impressions, which you can get from Google Search Console (GSC).
Impressions are how many links to your site a user saw on Google search results. GSC counts an impression anytime a user does a Google search and then views a page of results. This page of results is officially called a “Search Engine Results Page or SERP for short. If your page is on that SERP -, then an impression is counted. This is true even if the user did not scroll down the full page to view every single result on that SERP. Thankfully, if a user views only page 1 but the result is on page 2, Google doesn’t count the impression. If the user clicks on a search result, GSC counts it as a “click”.
When coupled with Click-through rate (CTR), both impressions and clicks can be a helpful education metric. The Click-through rate is a useful metric because it tells you how many people choose to click through to your site, after viewing an impression of your site in the search results. Google calculates the rate by taking thee click count and dividing it by the impression count.
While useful, GSC reports on every keyword phrase that users might query. Unfortunately, that can lead to an ocean of data that isn’t particularly relevant. Thus, we prefer to use the Semrush Visibility Index.
The Semrush Visibility index reports the click-through rate (CTR) that shows a website’s progress in Google’s top 100 search engine results for keywords from the current tracking campaign.
When we create a website, we list the keyword phrases that we want your site’s pages to rank highly for in Google results.
We create this list with our client and agree to pursue these Google rankings with search engine optimisation over time. This keyword phrase list includes a blend of what people are searching for and keywords that are relevant to what the practice offers.
For example, if you offer SMILE surgery, you may want to rank for laser eye surgery but not care so much about ranking for LASEK. So we would add variations of the SMILE surgery keyword phrase and write content to rank for that query in Google Search.
Importantly, this metric only reports on the keyword phrases we choose to have in our client’s tracking campaign. Furthermore, it’s only available with Semrush (via a paid subscription).
Here’s what it looks like:
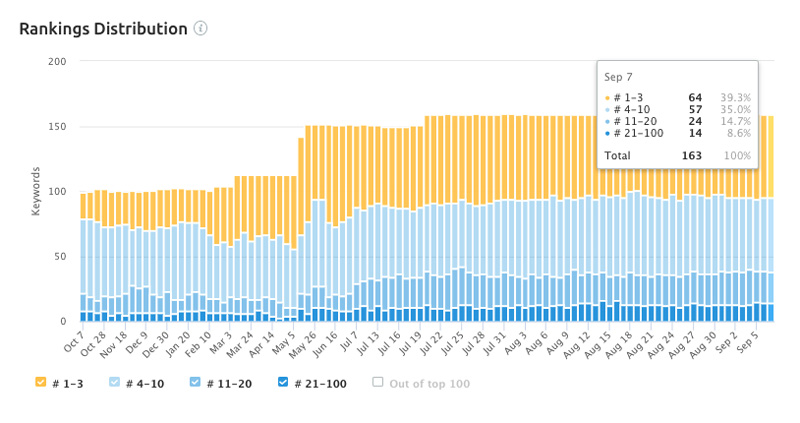
Our initial goal is to have 50% of our targeted keyword phrases show up in the top 10 results (the results that appear on the first page of Google Search Engine Results) after six months of SEO.
In the example above, we are tracking 163 keyword phrases. 39.3% of the keyword phrases we’re tracking appear in the top 1-3 Google results. 35% of our list appears in 4-10 results. All of these keyword phrases appear on Google’s first page. The remaining keywords show up between results 11 through 100 (pages 2 through 10).
We love the Search Visibility Index because we can compare how our clients rank against their top competitors. We illustrate that comparison in this redacted chart (we’ve redacted the domains to protect our client’s privacy):
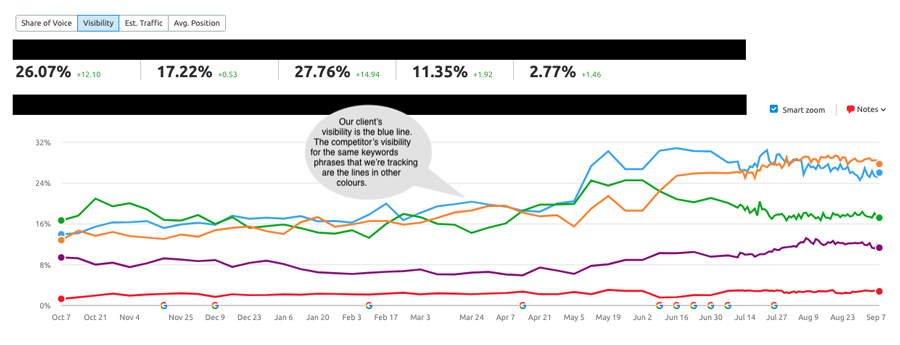
This chart provides us with the ability to provide our clients with comparative information about how they measure up in their market. For example, zero-percent visibility means that the domain isn’t ranking in Google’s top 100 results for any of these keywords, and a 100-per cent visibility means that the domain keeps the first position in the SERP for all these keywords.
This visualisation comes to life when we share this chart with them (we’ve redacted the domains to protect our client’s privacy):
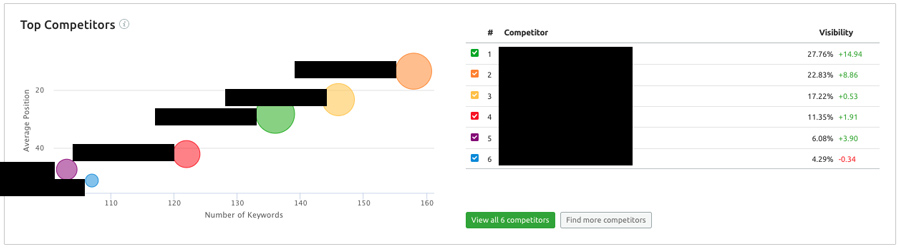
Figure 3
Note: Why don’t we list traffic as the most important metric? Because getting traffic is the job that your paid traffic team handles. You can get as much traffic that you are willing to pay for. Your website’s role is to be visible and engage your traffic from all channels (paid or unpaid). That leads us to the next four metrics, all measuring your site’s ability to engage users.
2. Bounce Rate: Your website should engage visitors to stay and click-through
The bounce rate is the percentage of visitors to a particular website who navigate away from the site after viewing only one page.
A high bounce rate indicates that the landing page experience did not meet your user’s expectations. What do your users expect? They want you to inform them or entertain them. Succeed in either, and you’ll persuade them to visit another page on your website.
For high-information services like eye surgery, bounce rate is an important metric to watch. Yours is not a news site, blog, event or sales page where the intention is to land – get what you need – and get out.
Why should you attempt to lower the bounce rate? Because converters tend to bounce less. For example, for a site with, an overall bounce rate of 57%, we observe that visitors who convert only bounce 28%. That ratio of high bounce rates for all users versus converters is a reliable ratio across websites we track. Thus, bounce rate is an excellent bellwether to determine whether your site engages users or not.
So, what influences your bounce rate?
The three most important factors that increase bounce rates include:
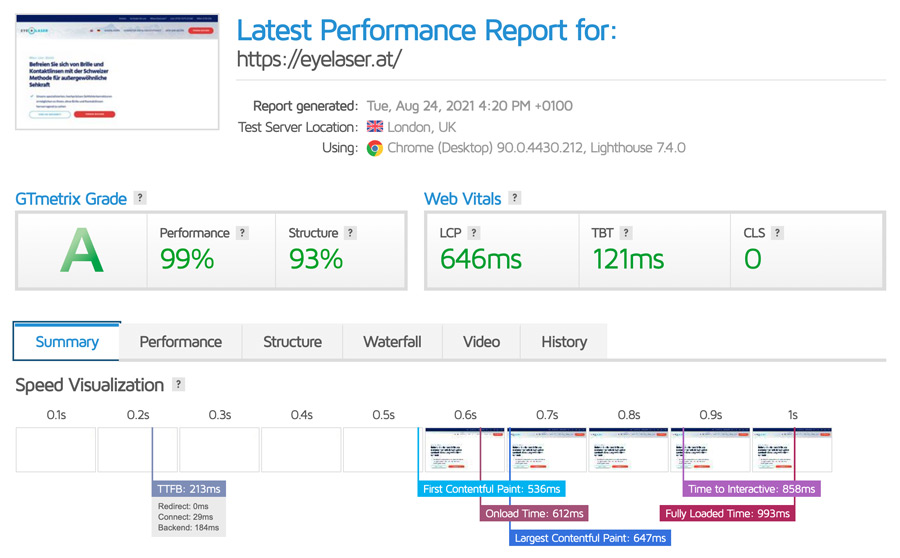
- Your pages load too slowly. Web speed is critical when users access websites with mobiles. These days, we’re noticing that most users visit websites offering laser eye surgery with mobile phones. Cataract surgery websites aren’t too far behind. We aim for website pages to load within 3 seconds or less. To check your site, I recommend checking your site on GTMetrix and look for “Fully Loaded Time”, as you can see in the image below. In the example below, the site has a fully loaded time of just under 1 second.
- You have too many hard-selling calls to action. Coming off too strong can alienate and repel prospects. That’s why we always aim to offer something the user can do that isn’t booking an appointment. For example, we will often give the user an option to download a guide or take a self-test. Then, we’ll invite the user to book an appointment after that.
- You confuse your users. An adage we live by here is, “If you confuse them, you lose them”. A user should be able to identify the essence of what you do within 3 seconds or less. Therefore, your headlines should be clear. Your images should portray who you help. Your promise should stand out. Your calls to action should be apparent. Your menu items should provide plain language labels that communicate what is on the other side of the link.
Sites tend to have a wide range of bounce rates, depending on the type of services they offer. To understand why this is, consider someone looking for “cataract surgery”. That person might be looking for free government surgery and if they hit a private practice offering cataract surgery – they will bounce.
A range of bounce rates between 41% to 69% is average.
As a rule of thumb, a bounce rate below 40% is a worthy goal. On the other hand, bounce rates over 70% for a refractive surgery website can signal one of the problems I’ve noted in the bullet points above.
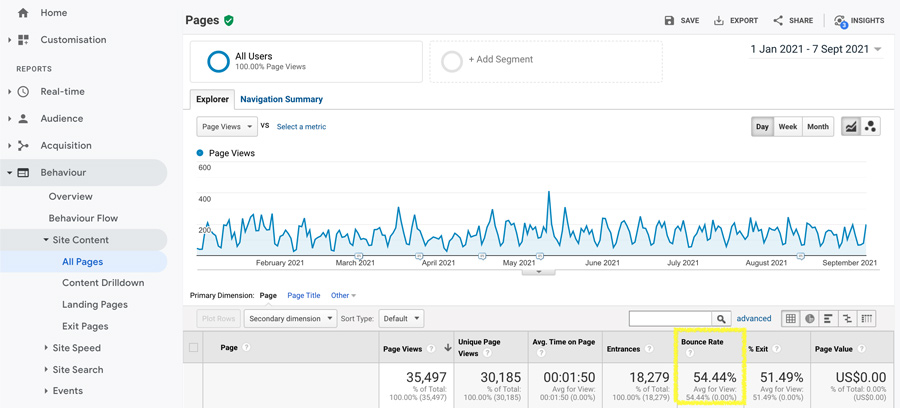
You can see your bounce rate on Google Analytics. Go to the Behaviour > Site Content > All Pages report to view it on a page level.
Here’s an example image (you can see the bounce rate in the yellow outline):
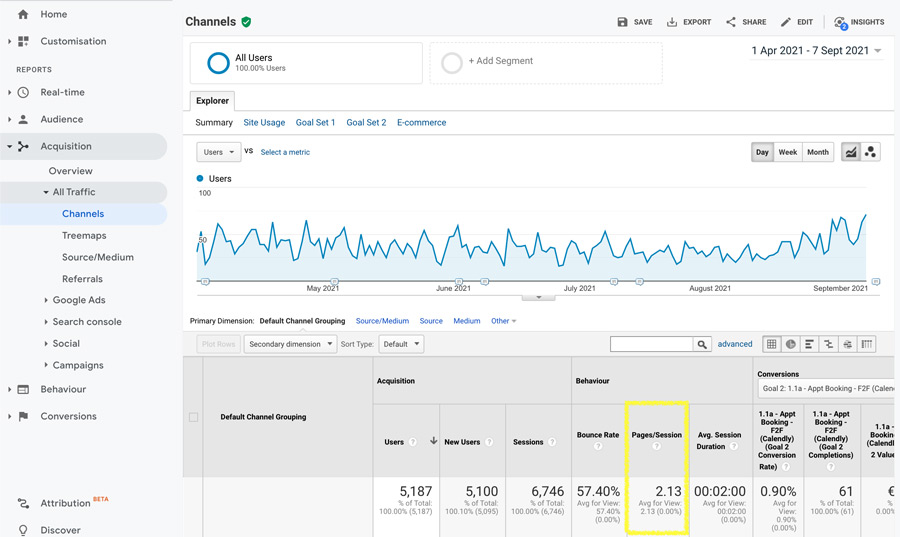
Another popular way to view bounce rate is by channel, which you can see by going to the Acquisition > All Traffic > Channels report. This report, for example, shows you how your bounce rate compares across your organic and paid visitors.
3. Pages/Session: Your website should invite users to browse
Similar to bounce rate, you’ll also find the statistic for pages/session in Google Analytics. According to GA, Pages/Session (or Average Page Depth) is the average number of pages viewed during a user session.
Think of it this way. As a user on this site, you might have landed on this blog post, read it and then moved on to look at our homepage. That would count as 2 pages/session. However, if you were to visit another blog post or even look at this one again, that would be 3 pages/session.
Why should you aim to increase pages/session? Because converters tend to have higher pages/session. For example, a site we track 2.12 for non-converters shows a pages/session figure of 2.92 for converters.
While we may wish otherwise, it’s rare to measure a pages/session that exceeds 2. Thus, we aim for 2 pages/session as a benchmark. Ideally, the two pages are a landing page that leads to a conversion and the resultant thank you page confirming the conversion.
Why do pages/session tend to be so low? Because most users that visit your website will not be ready to convert at that precise moment. They might be getting a question answered or looking up a quick fact. Your website’s job is to turn that glance into a stare.
There are several ways to increase pages/session. They include:
- writing content that empathises with your target audience
- mapping out the user journey to provide links that are natural next steps in their process
- making the pages more engaging
- telling users where to go next
- keeping web design simple
- creating a content hub
- writing catchier headlines
- improving site speed
- adding comparative internal links
- using CTA buttons
(NOTE: Want to see how your practice marketing measures up against the best in class? Take this 5-minute quiz to see how you stack up in the 9 areas of practice marketing and get specific tips and advice on how you can improve your weak points and better leverage your strengths).
4. Average Session Duration: Your website should keep visitors sufficiently engaged
Average session duration is also known as stickiness, as in “how sticky is your content?”.
When you visit a website, Google Analytics’s clock starts ticking. It measures how long you spend on that website (up to a limit of 30 minutes) and averages your time with all the other users who spent time on the site.
Again, converters tend to spend longer on websites than non-converters do.
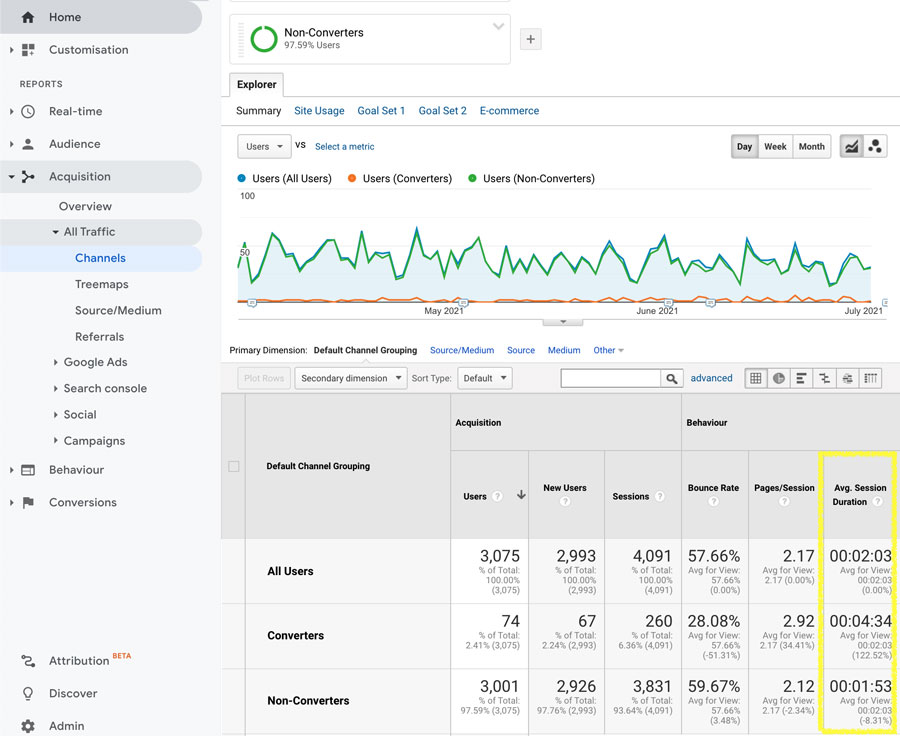
You can find your average session duration from the Acquisition > All Traffic > Channels report. As a benchmark, good session duration is between 2 to 3 minutes.
Longer sessions reflect more engaged visitors, so you want to take measures to increase your average session duration. These measures include:
- including videos in your pages
- breaking up text with images that either illustrate or engage visitors
- maximising the user-friendliness of your interface
- formatting your content so that it’s easy to read (legibility)
- writing your context so that it’s readable
- linking to other valuable and related pages on your website
- publishing content that is worth reading
5. Conversion Rate: Your website must convert
Identifying conversions on your website depends on setting the correct “goals”. But, you’ll need to go further than that to measure it for a refractive and cataract surgery practice website.
First, start with setting goals. Keep in mind that “goals” in Google Analytics are a bit of a misnomer. Google will track what you tell it to but do not confuse this with the idea of a “target”. Instead, a goal represents a completed activity which Google also calls a conversion.
Some meaningful examples of goals (or conversions) are:
- a user completes a self-test
- a user downloads a document
- a user registers for a webinar
- a user calls your clinic
- a user books an appointment online
Note that these conversions do not represent the same value.
We like to distinguish conversions from paid sources and unpaid sources. We typically want to see at least a 5% conversion rate from sessions to conversions of any type.
Start evaluating your website using these five metrics
Start using these five website metrics this month. You’ll create a helpful baseline for your website performance. You can then start to track how any future changes you make to your site either improve or decrease your performance against this essential baseline.
About the author

Rod Solar
Founder & Scalable Business Advisor / fCMO
Rod Solar is a co-founder of LiveseySolar and a Scalable Business Advisor for its customers. Rod mentors and coaches eye surgery business CEOs/Founders and their leadership teams to triple their sales, double their profit, and achieve their “ideal exit”.


Meet our Co-Founders
Rod Solar
Founder & Scalable Business Advisor
For over 20 years, I’ve helped ophthalmology entrepreneurs scale their private practices. I specialise in doubling revenue within three years by offering a proven framework, hands-on experience, and a team of experts who implement what works. We take the guesswork out of growth and scale, so you can focus on delivering exceptional patient care while maximising the value of your business.
LiveseySolar completely transformed the way we were approaching this… We’ve gone from having just the dream of having a practice to having a practice up and running with people making inquiries and booking for procedures… It’s extremely pleasing. We feel lucky we connected with LiveseySolar.
— Dr Matthew Russell, MBChB, FRANZCO, specialist ophthalmic surgeon and founder of VSON and OKKO

Laura Livesey
Founder & CEO
I’m the co-founder & CEO of LiveseySolar. I’ve developed powerful eye surgery marketing systems that increase patient volumes and profits for doctors, clinics, and hospitals, since 1997.
Rod and Laura know as much about marketing surgery to patients as I know about performing it. They are an expert in the field of laser eye surgery marketing. They know this industry inside out. I believe that they could help many companies in a variety of areas including marketing materials, sales training and marketing support for doctors.
— Prof. Dan Reinstein, MD MA FRSC DABO, founder of the London Vision Clinic, UK